How to Make a Sales Report in 5 Steps (+ Free Template)
Learn how to make a sales report in Excel in just 5 steps. Plus, grab a free template to track your WhatsApp sales with the metrics that matter most.

If you have ever wondered how to make a sales report for your online store, you are in the right place. Because yes, reports are not just for big companies: they are also the key to helping a small e-commerce business grow with intelligence.
In this article, I'll walk you step by step through how to build a basic sales report in Excel. We'll cover which elements your report should have and the most common types of reports. Plus, you can download an editable sales report 📊 to track your WhatsApp sales.
Thanks to the team at yavendió!, e-commerce experts, this template includes all the most important WhatsApp sales metrics. Don't miss it! ⚡
But let's start with the basics:
What is a sales report?
A sales report is a strategic document that gathers and analyzes the data from all your sales over a specific period, with the goal of understanding your commercial performance, spotting opportunities to improve and making decisions based on real data.
It is not just about knowing how much you sold, but understanding why it sold, to whom, how and with what profitability. A good sales report can reveal customer behavior patterns, the impact of marketing campaigns and the efficiency of your sales team.
In businesses where every data point counts, the sales report becomes a powerful tool for growing sustainably with a focus on profitability.
Key elements: What should a sales report include?
Every professional sales report should contain a few basic elements, such as:
- Date, month or period reported
- Product or service sold
- Quantity in units
- Unit price and total
- Sales channel (online store, WhatsApp, social media, etc.)
- Sales goal or target
And if you want an extra level of analysis, you can also include:
- Conversion rate (I recommend this article on conversion rates in e-commerce)
- Assigned sales rep (if applicable)
- Customer (name, region, type)
- Customer acquisition cost (CAC)
- Profit margin
Having this data well organized is the first step to understanding the state of your sales.
How to make a sales report in Excel in 5 steps
Now that you know what a sales report is and what it should include, it is time to put it into practice.
Here I'll explain how to make a sales report in Excel in 5 steps. Each step is designed to make your report clear, easy to update and useful for making business decisions.
👉 For this example, let's imagine your team is running a Christmas campaign and you have a set inventory to sell. So the goal is to know how many products are going out the door and whether you'll hit the target.
How to make a sales report: Step 1
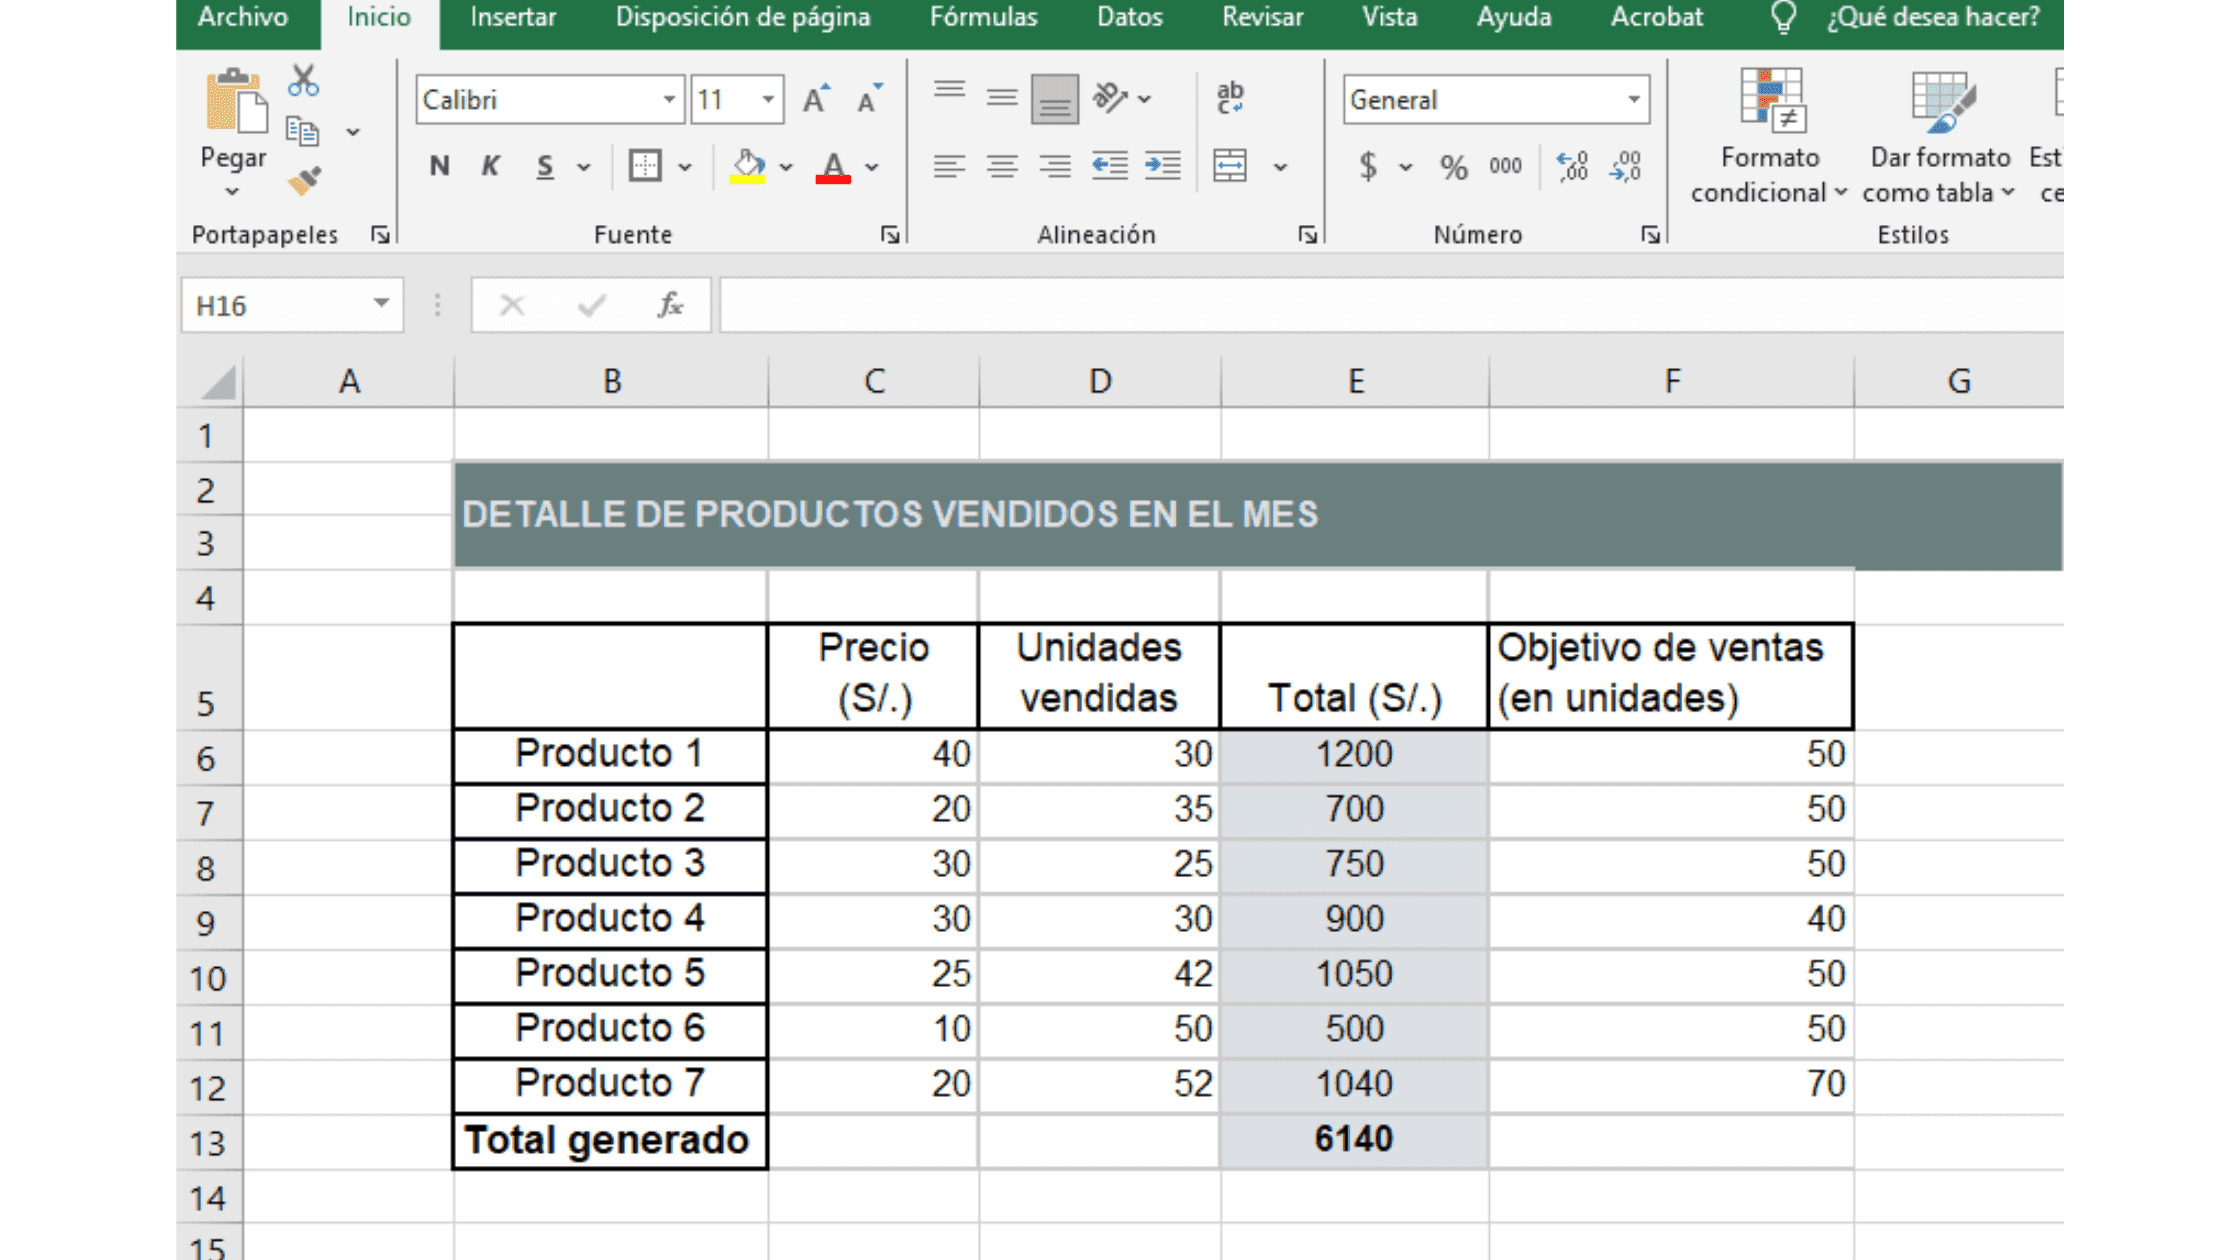
We're going to create a sales table by product. To do this, include the name of each product in your inventory, the unit price, the units sold and (super important) your sales goal.
💡 Tip: The total ($) for each product is easily calculated with the formula “=unit price * units sold”. Apply it to every cell in that column. In the example, it is column E.
How to make a sales report: Step 2
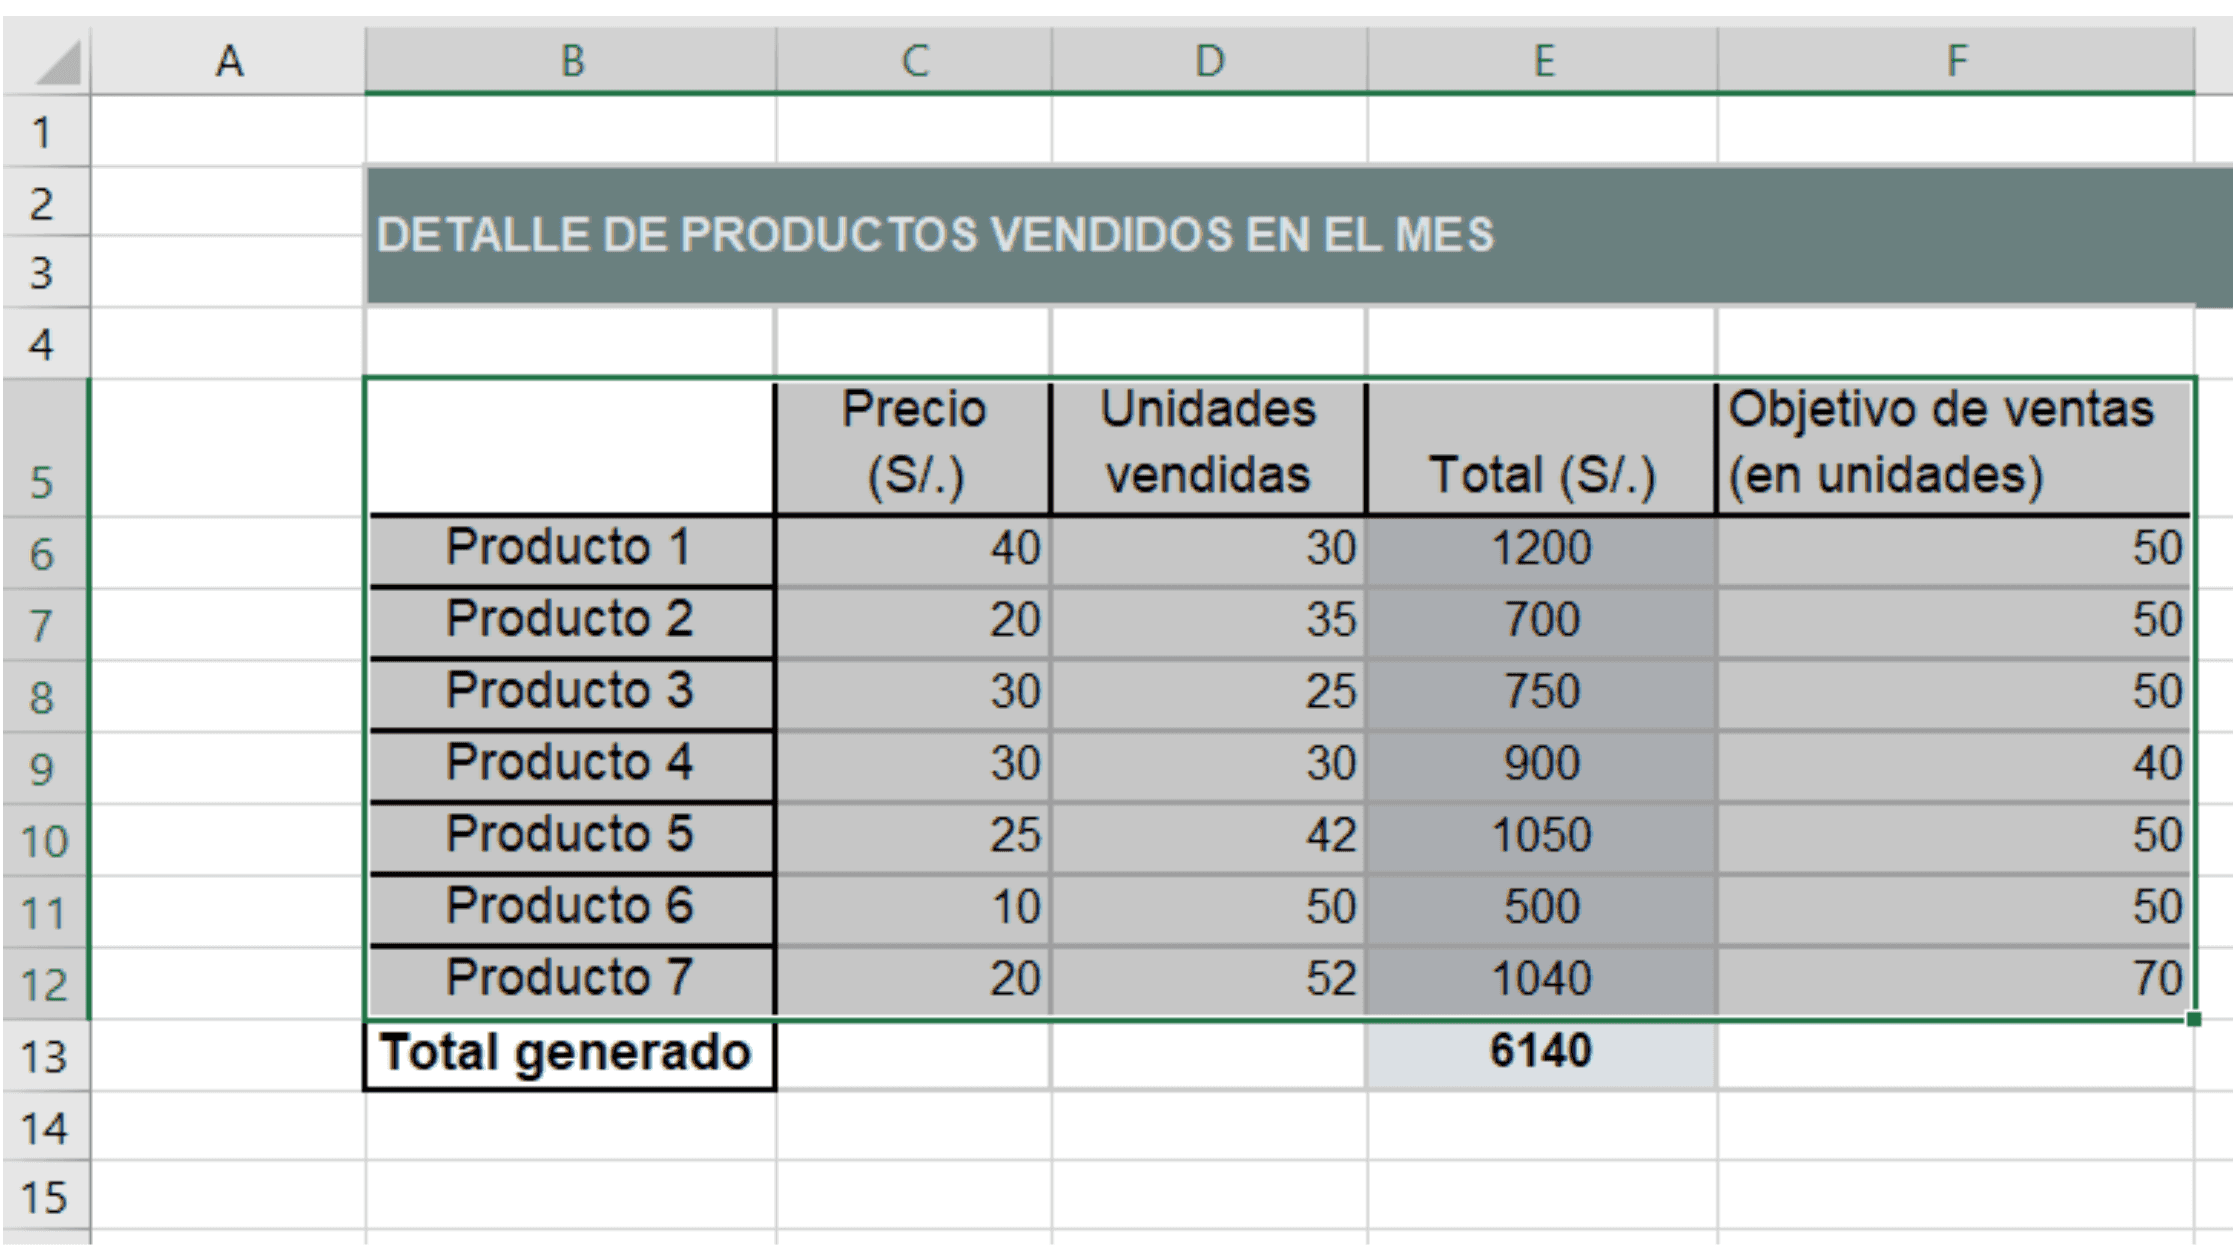
Now, select all the columns with your product information. Make sure to include the table headers. Just like in this image:
How to make a sales report: Step 3
To create the first chart in your sales report, do the following. With your table selected, go to Insert > Recommended Charts. A window like this will open:
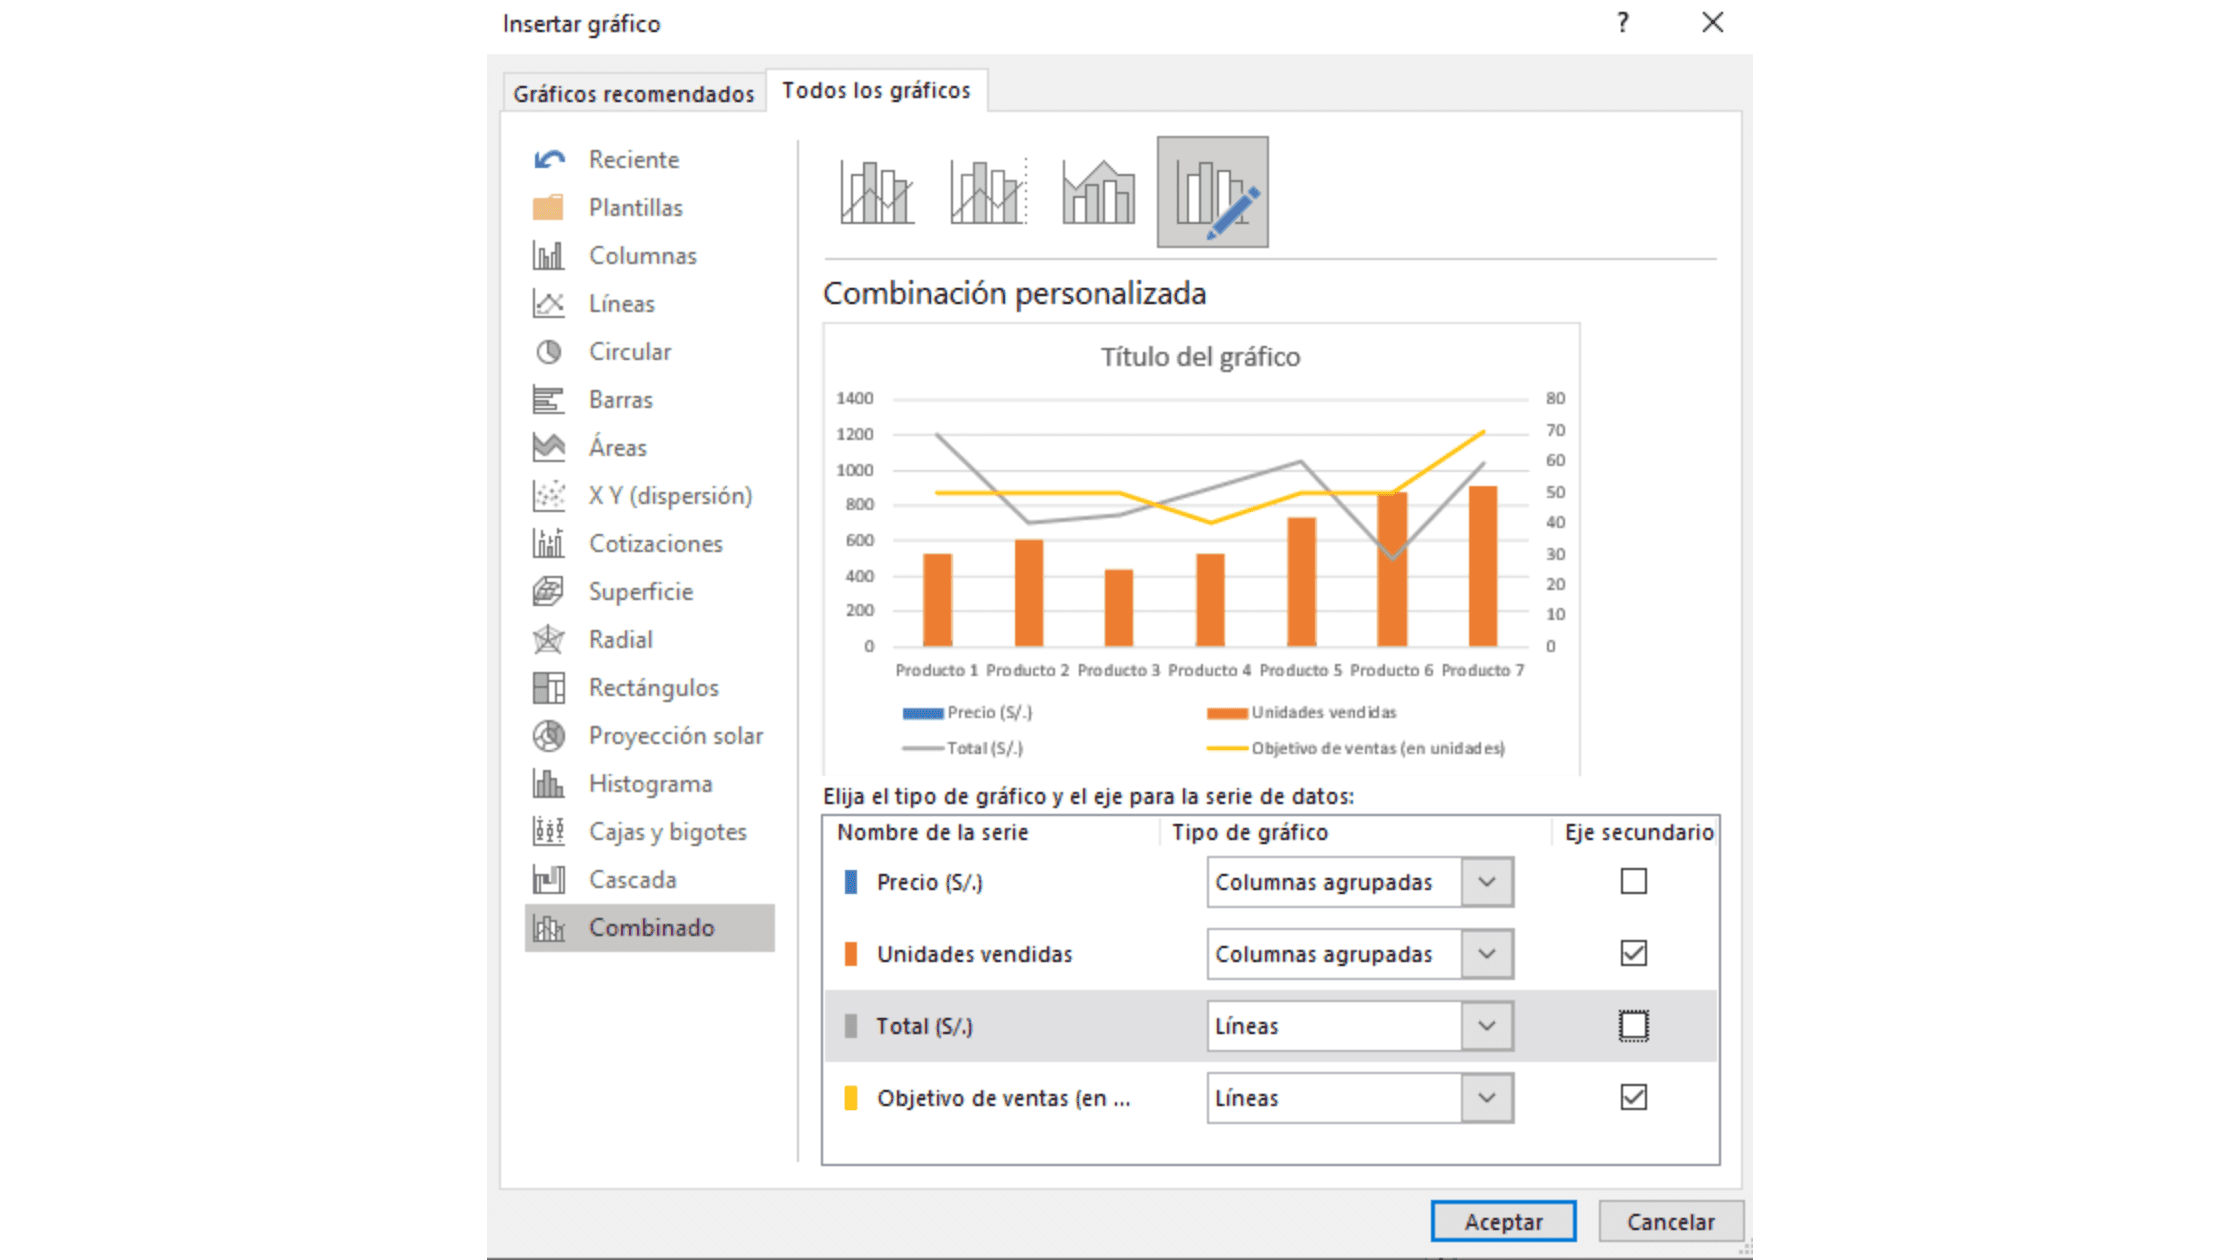
In the “All Charts” section, click “Combo” and choose the last chart for a custom combination. Then hit “OK”.
How to make a sales report: Step 4
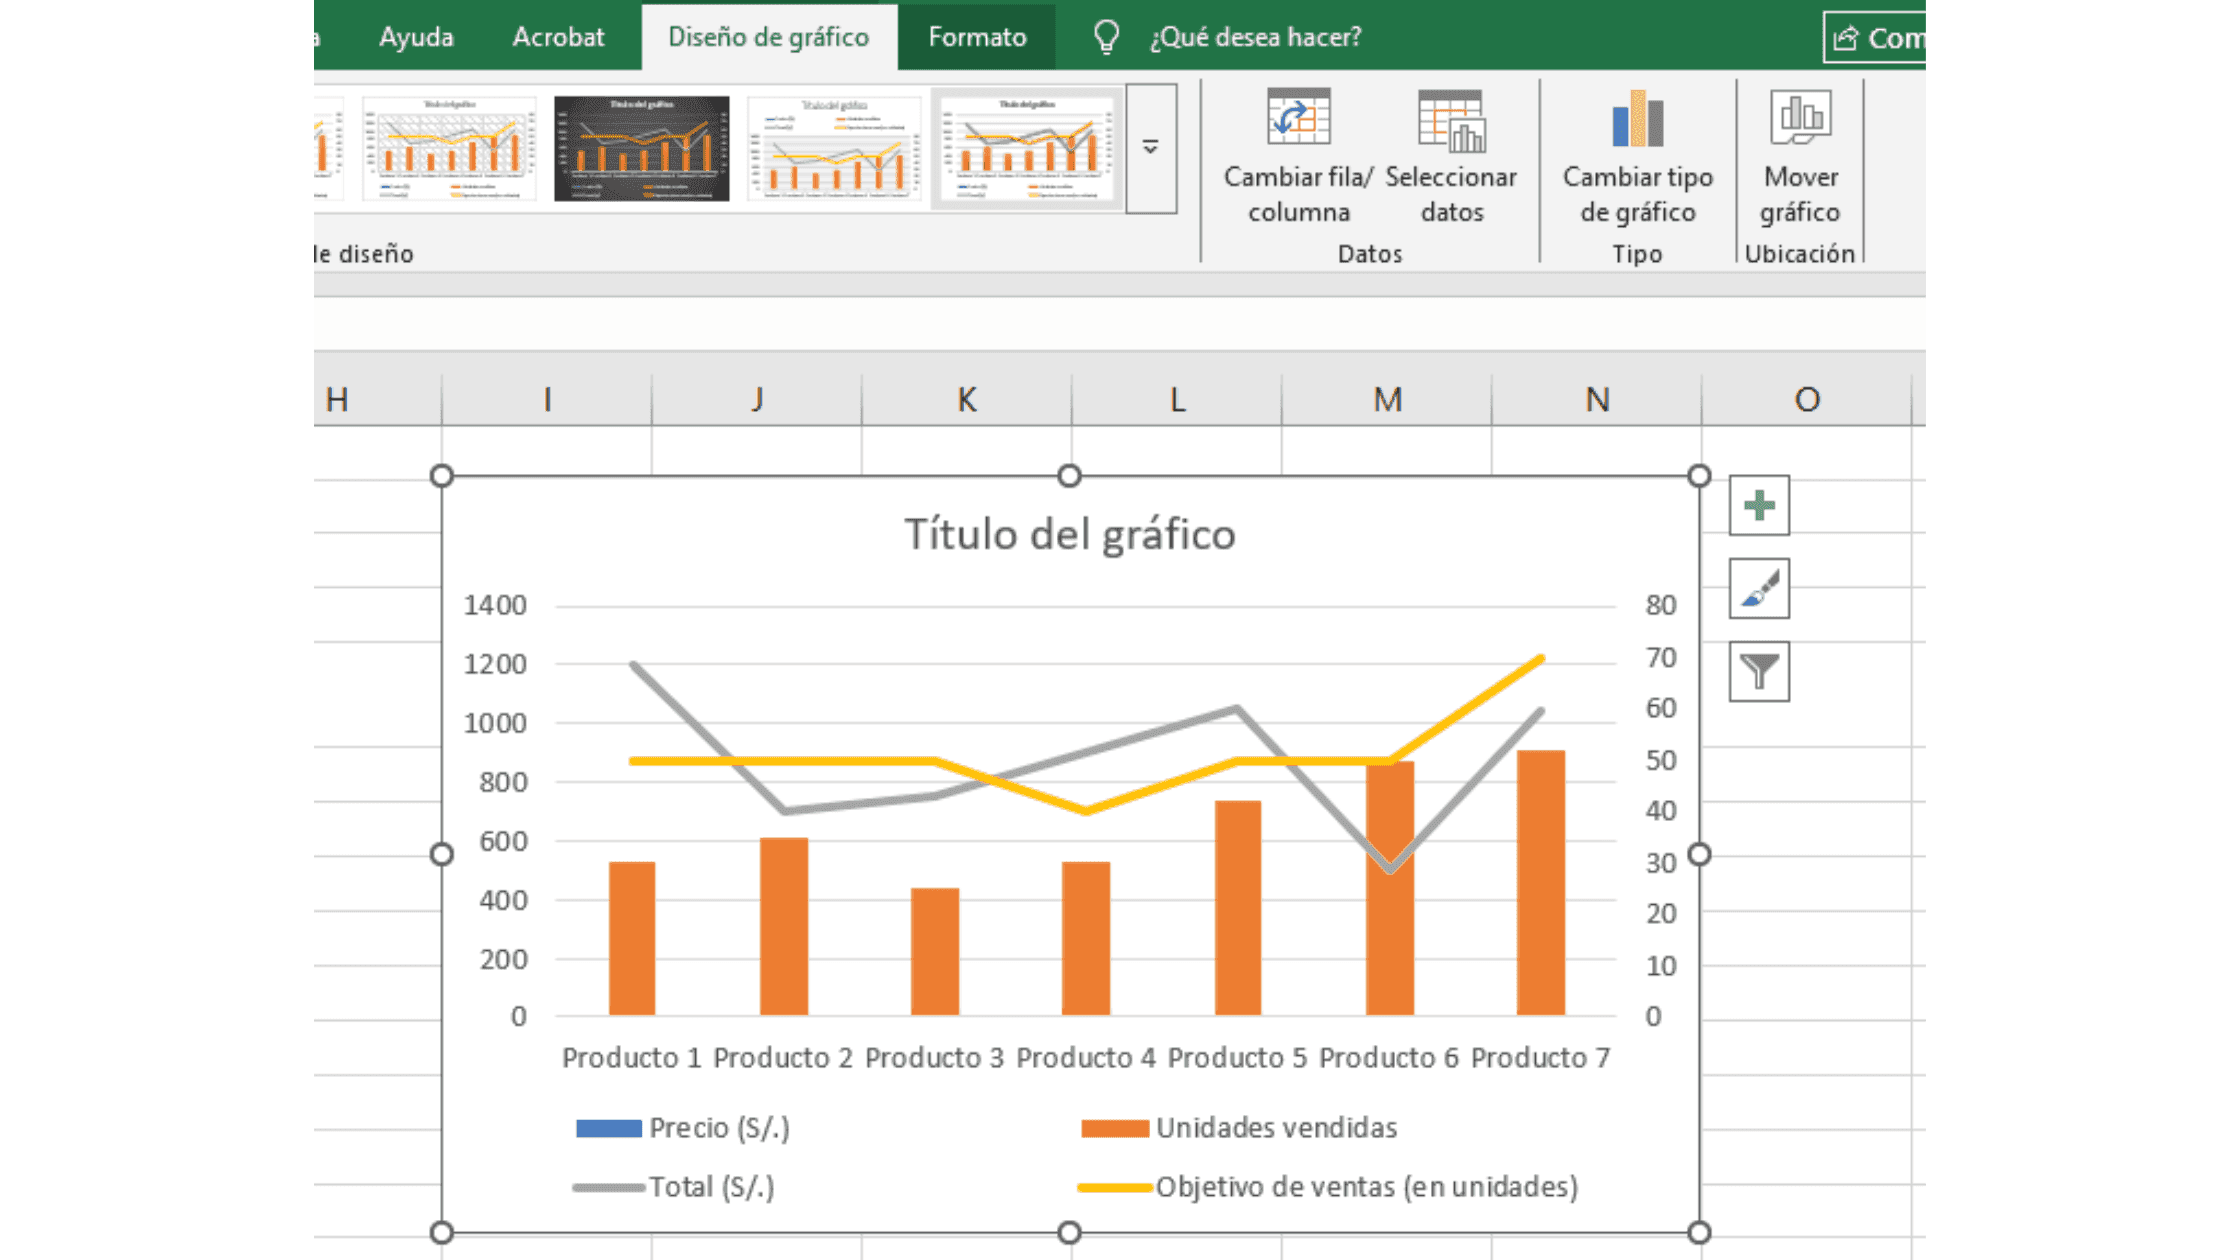
A chart with columns and lines will be generated automatically, but it is not done yet. We need to clean up the data. To do this, select your chart and go to “Select Data” on the “Chart Design” ribbon.
💡 Tip: The buttons for editing your chart are only enabled when it is selected. If you don't see them, double-click on your chart.
A window like this will open, where you simply need to uncheck the boxes for “Price ($)” and “Total ($)”.
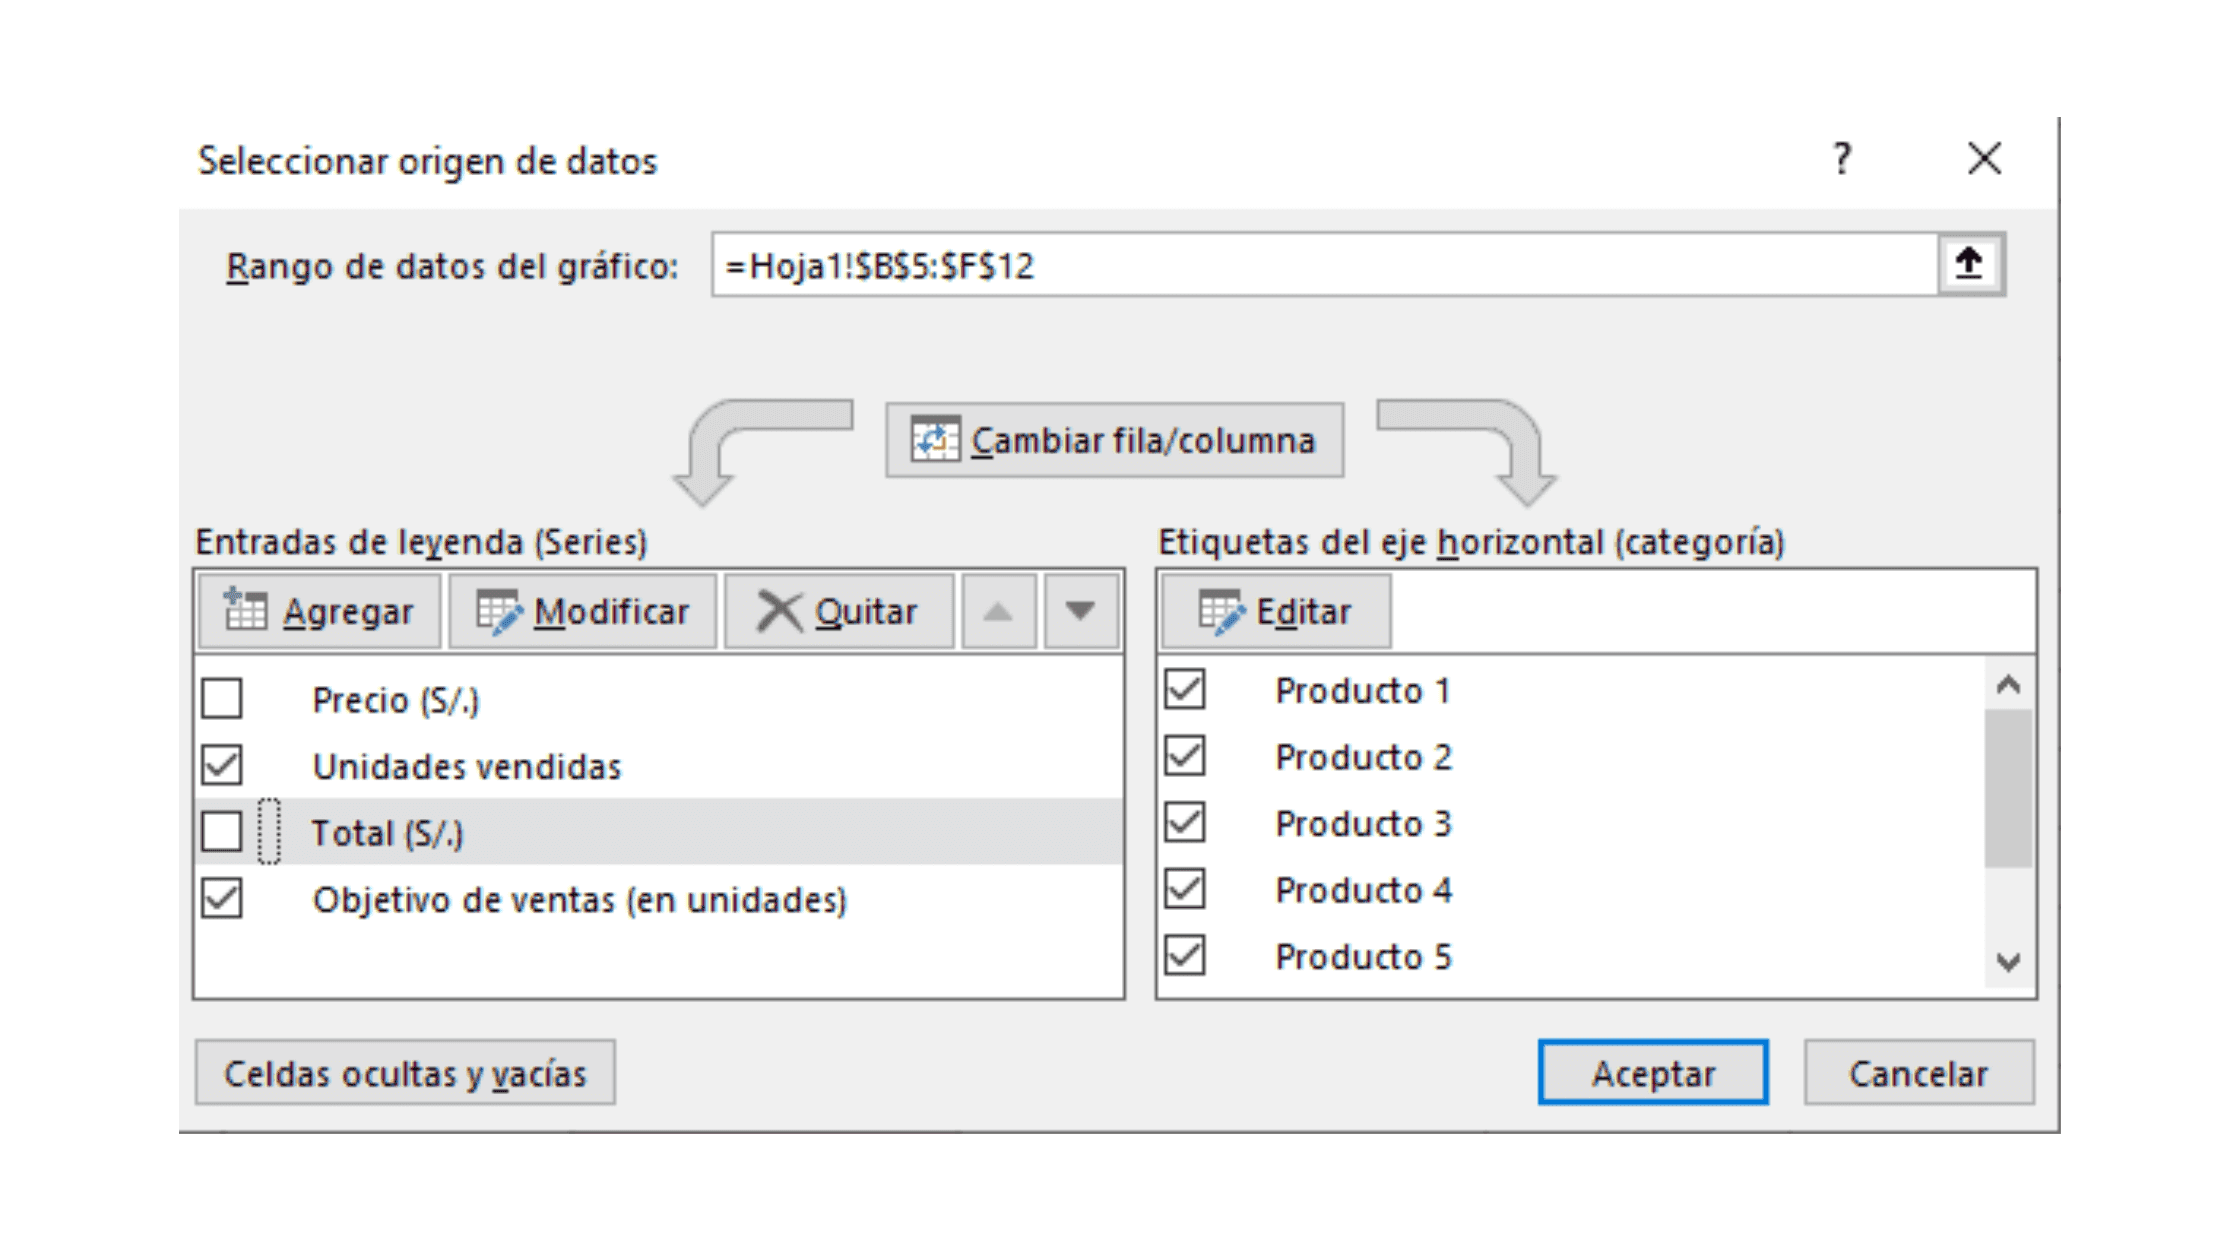
Why? Our goal is to know how many products are being sold during the campaign and how far we are from hitting the target.
If you wanted that data in monetary value, then check only the ($) variables 😉
How to make a sales report: Step 5
Finally, you'll have a clean chart that is pretty easy to read. If you like, you can change the colors or edit the title however you want. For this example, I put: "Product sales for the month".
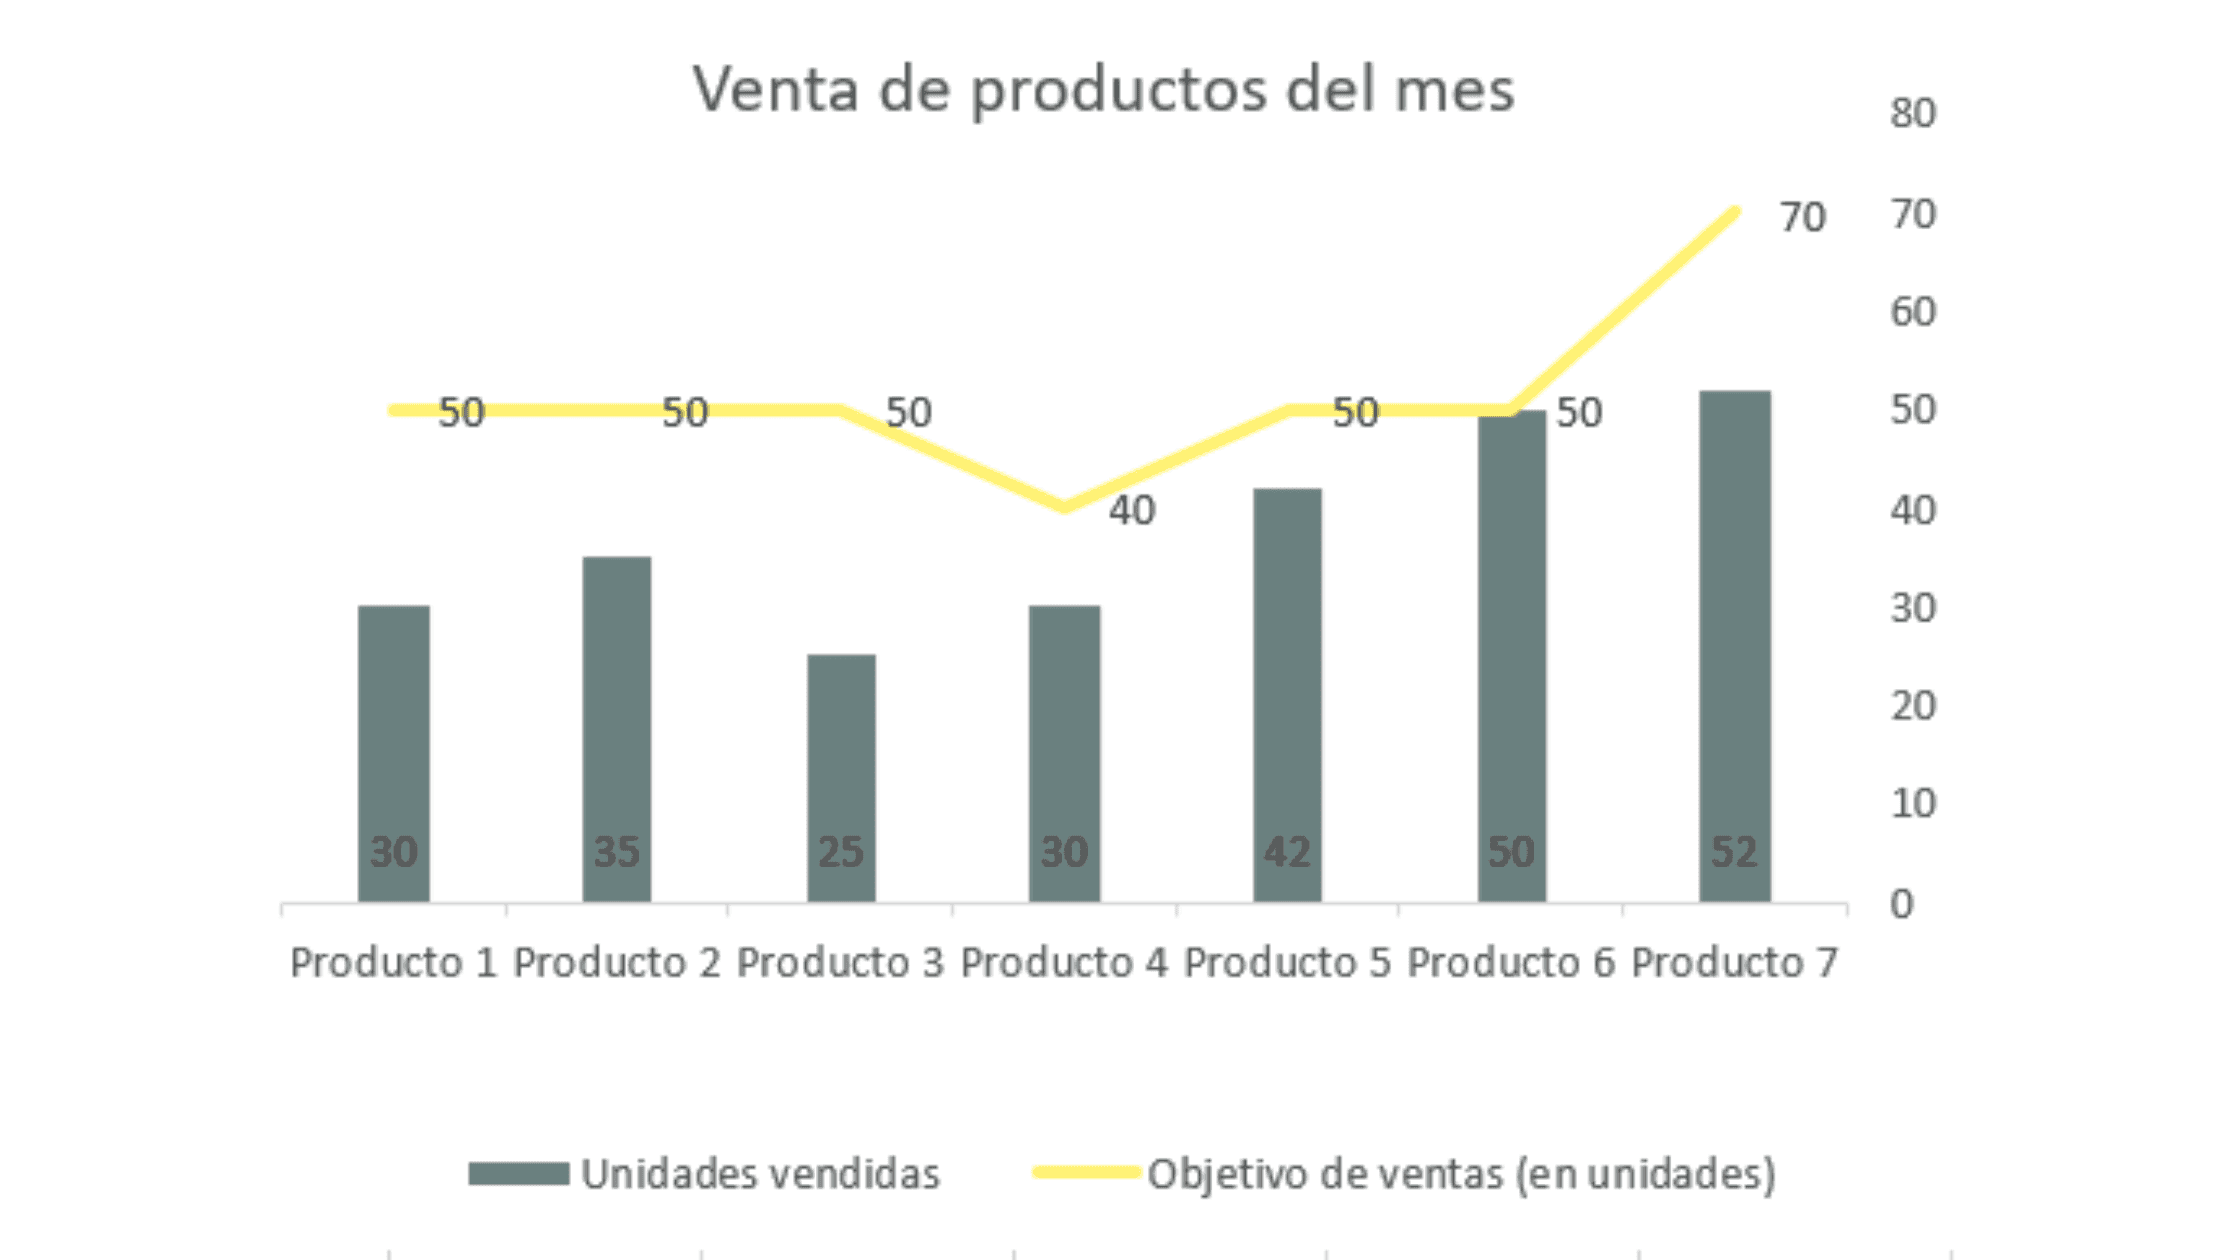
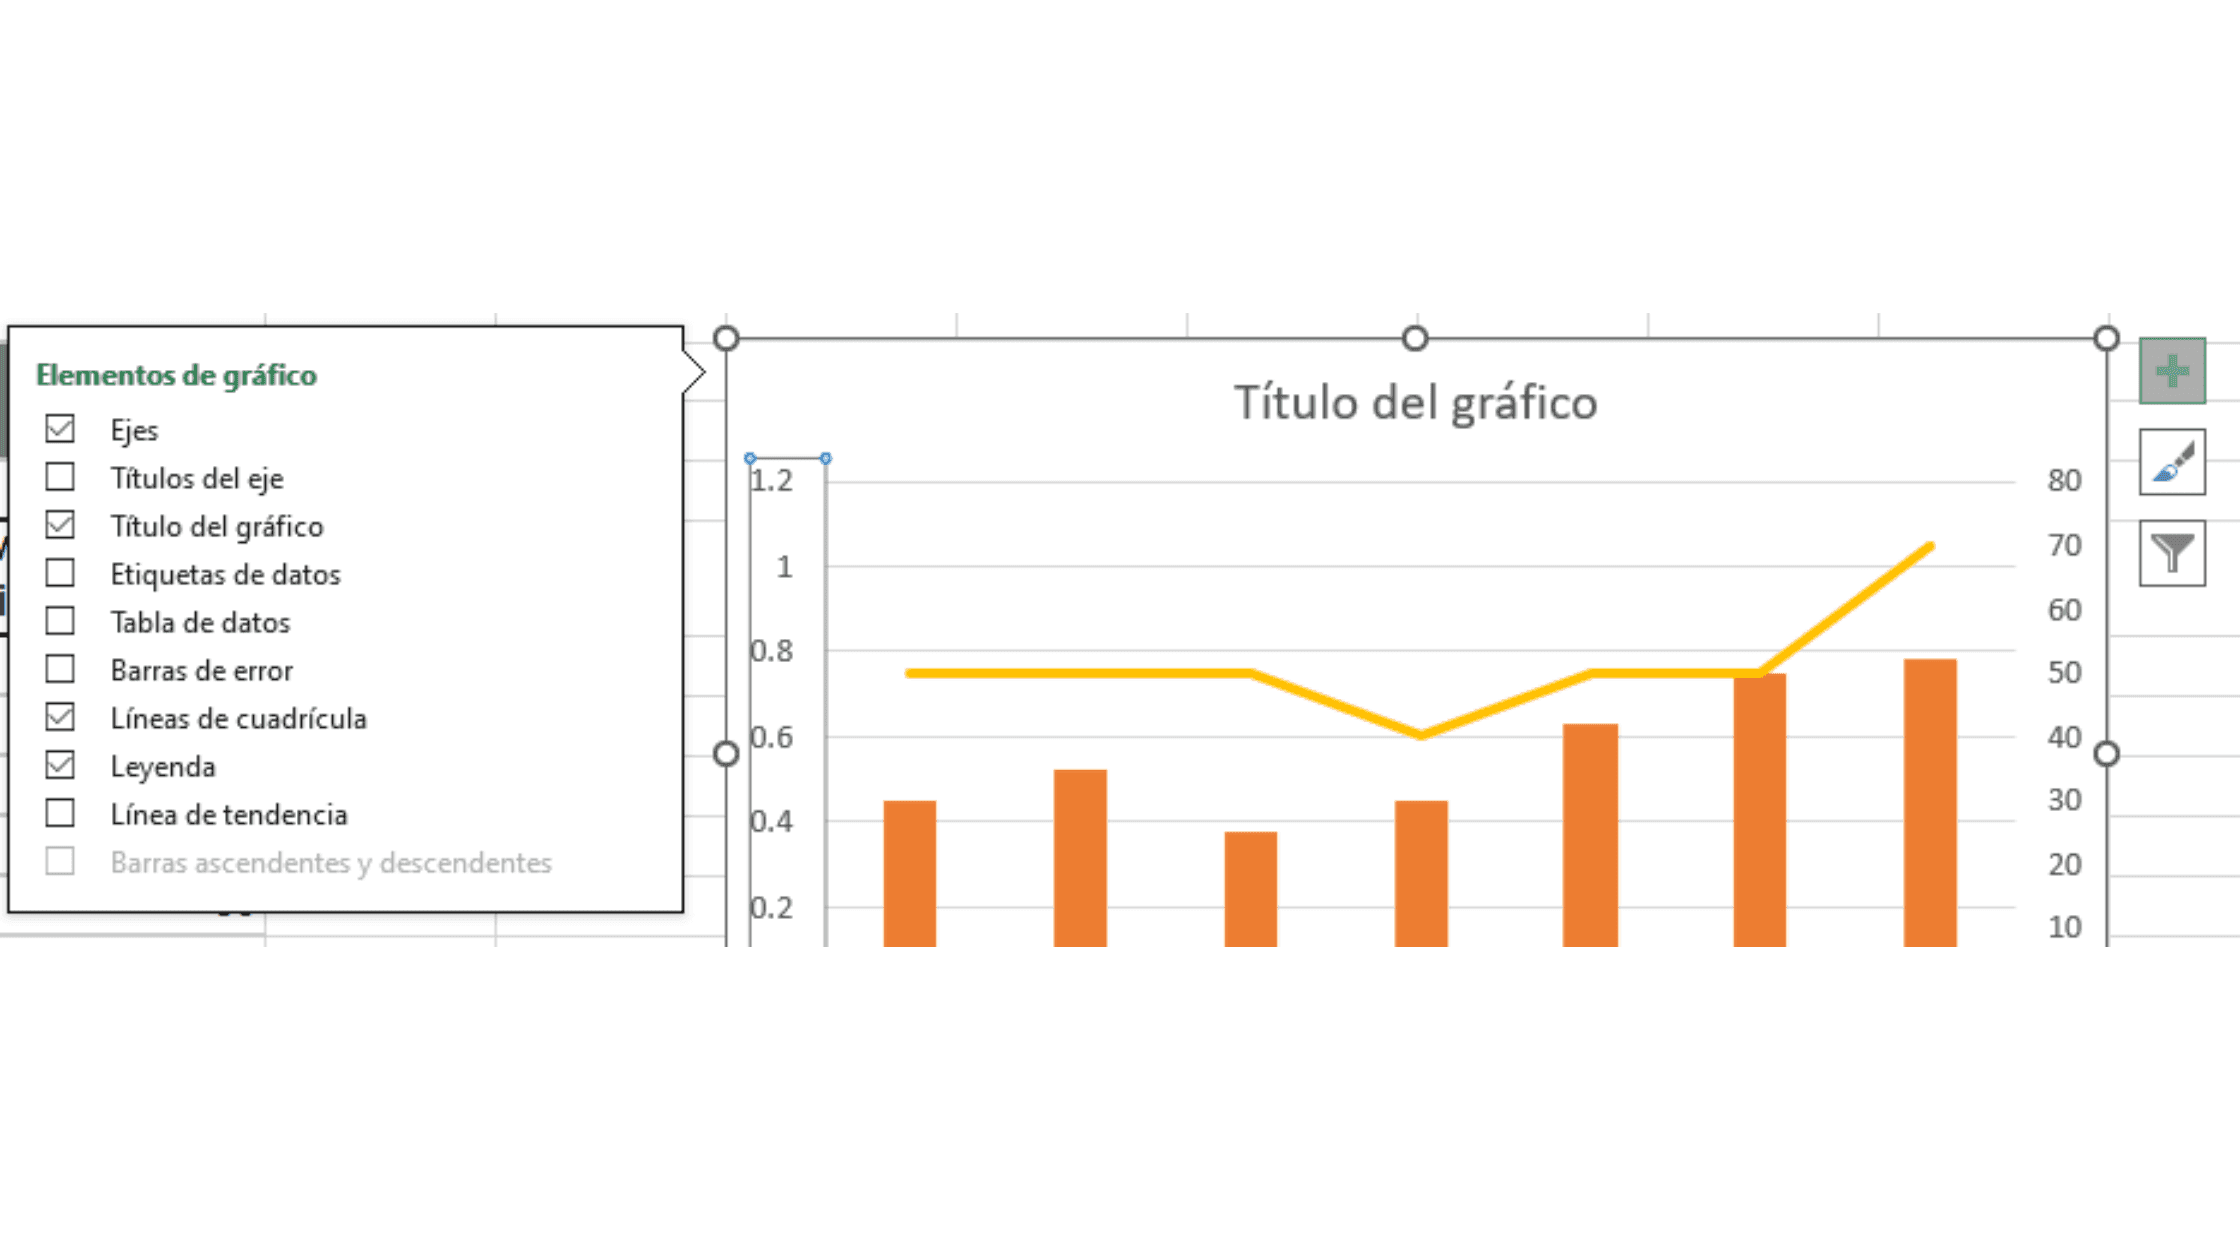
If you see some extra numbers on one of the sides, follow this optional step:
- Select the chart and click the “+” icon that appears on the side. Go to Axes > Uncheck the “Secondary Vertical” option and you're all set! You'll get a cleaner chart for your report.
Types of sales reports
You should know there is not just one type of sales report. And that is the great thing about it! You can adapt your reports to your goal or whatever you need to analyze. Here are some examples of the most common sales reports:
- Daily sales report: Ideal for monitoring progress from one day to the next, especially during campaigns or promotions. This type of report is perfect when you need to react quickly to market changes or adjust strategies on the fly.
- Weekly or monthly report: The most common one. It lets you see how sales behave over longer periods and identify real trends without the noise of daily fluctuations.
- Report by product or category: Like our example! Discover which products generate the most revenue and which ones have low turnover. This kind of analysis is essential for optimizing your inventory and focusing your marketing efforts where they really matter.
- Sales rep report: If you have a sales team, you can see how effective each person is. This is not just about identifying your best rep, but understanding which techniques work best and replicating them across the whole team.
- Report by channel: Compare performance across your online store, social media, WhatsApp, etc. Today most businesses sell through multiple channels, and it is important to know which one is delivering the best results.
Template: WhatsApp sales report (free download 🎁)
And speaking of reports by channel… if your main sales channel is WhatsApp, you are going to love this template. Get the free template to report your WhatsApp sales here:

It includes:
- The sales funnel for WhatsApp (with the key metrics of conversational commerce)
- A record of your conversion rate on WhatsApp
- A product detail table for what you're selling
- A chart of sales closed per day (so you can monitor your team's performance)
- And of course, the product sales for the month chart (the one we saw in our example!)
Use it as the foundation for building your own sales report.
Metrics for an effective sales report
Now, if you want to make your WhatsApp sales reports even more powerful and strategic, you can add these metrics:
- Best-selling product: Shows you which items are in the highest demand among your customers.
- Peak sales hours: Identify the times of day when your customers are most active and ready to buy.
- Average response time: Measures how quickly you reply to messages. A low response time builds trust and improves the customer experience.
- # of unanswered conversations: Counts how many potential customer inquiries went without a reply.
- Average service rating: This metric tells you whether your customer service is creating a positive experience that drives repeat purchases.
- # of returning customers: Identifies how many of your customers have made more than one purchase through WhatsApp.
Include a qualitative section for insights and opportunities with these questions:
- What worked well this week?
- What can be improved?
- What automation opportunities did we spot?
Sell more on WhatsApp with a virtual seller 🤖
You now know how to make a sales report that gives you clarity on what works in your business. Now imagine having a sales channel that works for you 24/7, without you having to be glued to your phone.
Meet yavendió! and our artificial intelligence (AI) for WhatsApp - designed specifically for businesses that sell online. With yavendió! you can have an AI sales agent that serves your customers instantly, recommends products and even closes sales with no human intervention.
Want to see how it works? Message us today on WhatsApp and we'll send you a free demo.
Ready to sell more with AI?
Create your free AI agent in minutes. No card. No install.